


A handful of good metagenomics papers have come out over the last few months. Below I've linked to and copied my evaluation of each of these articles from F1000.
...
1. Willner, Dana, and Philip Hugenholtz. "From deep sequencing to viral tagging: Recent advances in viral metagenomics." BioEssays (2013).
My evaluation: This review lays out some of the challenges and recent advances in viral metagenomic sequencing. There is a good discussion of library preparation and how that affects downstream sequencing. Alarmingly, they reference another paper that showed that different amplification methods resulted in detection of a completely different set of viruses (dsDNA viruses with LASL, ssDNA with MDA). The review also discusses many of the data management, analysis, and bioinformatics challenges associated with viral metagenomics.
...
2. Loman, Nicholas J., et al. "A Culture-Independent Sequence-Based Metagenomics Approach to the Investigation of an Outbreak of Shiga-Toxigenic Escherichia coli O104: H4Outbreak of Shiga-toxigenic Escherichia coli." JAMA 309.14 (2013): 1502-1510.
My evaluation: This paper is a groundbreaking exploration of the use of metagenomics to investigate and determine the causal organism of an infectious disease outbreak. The authors retrospectively collected fecal samples from symptomatic patients from the 2011 Escherichia coli O104:H4 outbreak in Germany and performed high-throughput shotgun sequencing, followed by a sophisticated analysis to determine the outbreak's causal organism. The analysis included comparing genetic markers from many symptomatic patients' metagenomes with those of healthy controls, followed by de novo assembly of the outbreak strain from the shotgun metagenomic data. This illustrates both the power, but the real limitations, of using metagenomic approaches for clinical diagnostics. Also see David Relman's synopsis of the study in the same JAMA issue
...
3. Shakya, Migun, et al. "Comparative metagenomic and rRNA microbial diversity characterization using archaeal and bacterial synthetic communities." Environmental microbiology (2013).
My evaluation: This study set out to compare shotgun metagenomic sequencing to 16S rRNA amplicon sequencing to determine the taxonomic and abundance profiles of mixed community metagenomic samples. Thus far, benchmarking metagenomic methodology has been difficult due to the lack of datasets where the underlying ground truth is known. In this study, the researchers constructed synthetic metagenomic communities consisting of 64 laboratory mixed genome DNAs of known sequence and polymerase chain reaction (PCR)-validated abundance. The researchers then compared metagenomic and 16S amplicon sequencing, using both 454 and Illumina technology, and found that metagenomic sequencing outperformed 16S sequencing in quantifying community composition. The synthetic metagenomes constructed here are publicly available (Gene Expression Omnibus [GEO] accession numbers are given in the manuscript), which represent a great asset to other researchers developing methods for amplicon-based or metagenomic approaches to sequence classification, diversity analysis, and abundance estimation.
Showing posts with label Recommended Reading. Show all posts
Showing posts with label Recommended Reading. Show all posts
Software Carpentry Bootcamp at University of Virginia
A couple of weeks ago I, with the help of others here at UVA, organized a Software Carpentry bootcamp, instructed by Steve Crouch, Carlos Anderson, and Ben Morris. The day before the course started, Charlottesville was racked by nearly a foot of snow, widespread power outages, and many cancelled incoming flights. Luckily our instructors arrived just in time, and power was (mostly) restored shortly before the boot camp started. Despite the conditions, the course was very well-attended.
 Software Carpentry's aim is to teach researchers (usually graduate students) basic computing concepts and skills so that they can get more done in less time, and with less pain. They're a volunteer organization funded by Mozilla and the Sloan foundation, and led this two-day bootcamp completely free of charge to us.
The course started out with a head-first dive into Unix and Bash scripting, followed by a tutorial on automation with Make, concluding the first day with an introduction to Python. The second day covered version control with git, Python code testing, and wrapped up with an introduction to databases and SQL. At the conclusion of the course, participants offered near-universal positive feedback, with the git and Make tutorials being exceptionally popular.
Software Carpentry's approach to teaching these topics is unlike many others that I've seen. Rather than lecturing on for hours, the instructors inject very short (~5 minute) partnered exercises between every ~15 minutes of instruction in 1.5 hour sessions. With two full days of intensive instruction and your computer in front of you, it's all too easy to get distracted by an email, get lost in your everyday responsibilities, and zone out for the rest of the session. The exercises keep participants paying attention and accountable to their partner.
All of the bootcamp's materials are freely available:
Unix and Bash: https://github.com/redcurry/bash_tutorial
Python Introduction: https://github.com/redcurry/python_tutorial
Git tutorial: https://github.com/redcurry/git_tutorial
Databases & SQL: https://github.com/bendmorris/swc_databases
Everything else: http://users.ecs.soton.ac.uk/stc/SWC/tutorial-materials-virginia.zip
Perhaps more relevant to a broader audience are the online lectures and materials available on the Software Carpentry Website, which include all the above topics, as well as many others.
We capped the course at 50, and had 95 register within a day of opening registration, so we'll likely do this again in the future. I sit in countless meetings where faculty lament how nearly all basic science researchers enter grad school or their postdoc woefully unprepared for this brave new world of data-rich high-throughput science. Self-paced online learning works well for some, but if you're in a department or other organization that could benefit from a free, on-site, intensive introduction to the topics listed above, I highly recommend contacting Software Carpentry and organizing your own bootcamp.
Finally, when organizing an optional section of the course, we let participants vote whether they preferred learning number crunching with NumPy, or SQL/databases; SQL won by a small margin. However, Katherine Holcomb in UVACSE has graciously volunteered to teach a two-hour introduction to NumPy this week, regardless of whether you participated in the boot camp (although some basic Python knowledge is recommended). This (free) short course is this Thursday, March 21, 2-4pm, in the same place as the bootcamp (Brown Library Classroom in Clark Hall). Sign up here.

The course started out with a head-first dive into Unix and Bash scripting, followed by a tutorial on automation with Make, concluding the first day with an introduction to Python. The second day covered version control with git, Python code testing, and wrapped up with an introduction to databases and SQL. At the conclusion of the course, participants offered near-universal positive feedback, with the git and Make tutorials being exceptionally popular.
Software Carpentry's approach to teaching these topics is unlike many others that I've seen. Rather than lecturing on for hours, the instructors inject very short (~5 minute) partnered exercises between every ~15 minutes of instruction in 1.5 hour sessions. With two full days of intensive instruction and your computer in front of you, it's all too easy to get distracted by an email, get lost in your everyday responsibilities, and zone out for the rest of the session. The exercises keep participants paying attention and accountable to their partner.
All of the bootcamp's materials are freely available:
Unix and Bash: https://github.com/redcurry/bash_tutorial
Python Introduction: https://github.com/redcurry/python_tutorial
Git tutorial: https://github.com/redcurry/git_tutorial
Databases & SQL: https://github.com/bendmorris/swc_databases
Everything else: http://users.ecs.soton.ac.uk/stc/SWC/tutorial-materials-virginia.zip
Perhaps more relevant to a broader audience are the online lectures and materials available on the Software Carpentry Website, which include all the above topics, as well as many others.
We capped the course at 50, and had 95 register within a day of opening registration, so we'll likely do this again in the future. I sit in countless meetings where faculty lament how nearly all basic science researchers enter grad school or their postdoc woefully unprepared for this brave new world of data-rich high-throughput science. Self-paced online learning works well for some, but if you're in a department or other organization that could benefit from a free, on-site, intensive introduction to the topics listed above, I highly recommend contacting Software Carpentry and organizing your own bootcamp.
Finally, when organizing an optional section of the course, we let participants vote whether they preferred learning number crunching with NumPy, or SQL/databases; SQL won by a small margin. However, Katherine Holcomb in UVACSE has graciously volunteered to teach a two-hour introduction to NumPy this week, regardless of whether you participated in the boot camp (although some basic Python knowledge is recommended). This (free) short course is this Thursday, March 21, 2-4pm, in the same place as the bootcamp (Brown Library Classroom in Clark Hall). Sign up here.
Comparing Sequence Classification Algorithms for Metagenomics
Metagenomics is the study of DNA collected from environmental samples (e.g., seawater, soil, acid mine drainage, the human gut, sputum, pus, etc.). While traditional microbial genomics typically means sequencing a pure cultured isolate, metagenomics involves taking a culture-free environmental sample and sequencing a single gene (e.g. the 16S rRNA gene), multiple marker genes, or shotgun sequencing everything in the sample in order to determine what's there.
A challenge in shotgun metagenomics analysis is the sequence classification problem: i.e., given a sequence, what's it's origin? I.e., did this sequence read come from E. coli or some other enteric bacteria? Note that sequence classification does not involve genome assembly - sequence classification is done on unassembled reads. If you could perfectly classify the origin of every sequence read in your sample, you would know exactly what organisms are in your environmental sample and how abundant each one is.
The solution to this problem isn't simply BLAST'ing every sequence read that comes off your HiSeq 2500 against NCBI nt/nr. The computational cost of this BLAST search would be many times more expensive than the sequencing itself. There are many algorithms for sequence classification. This paper examines a wide range of the available algorithms and software implementations for sequence classification as applied to metagenomic data:
Bazinet, Adam L., and Michael P. Cummings. "A comparative evaluation of sequence classification programs." BMC Bioinformatics 13.1 (2012): 92.
In this paper, the authors comprehensively evaluated the performance of over 25 programs that fall into three categories: alignment-based, composition-based, and phylogeny-based. For illustrative purposes, the authors constructed a "phylogenetic tree" that shows how each of the 25 methods they evaluated are related to each other:
The performance evaluation was done on several different datasets where the composition was known, using a similar set of evaluation criteria (sensitivity = number of correct assignments / number of sequences in the data; precision = number of correct assignments/number of assignments made). They concluded that the performance of particular methods varied widely between datasets due to reasons like highly variable taxonomic composition and diversity, level of sequence representation in underlying databases, read lengths, and read quality. The authors specifically point out that just because some methods lack sensitivity (as they've defined it), they are still useful because they have high precision. For example, marker-based approaches (like Metaphyler) might only classify a small number of reads, but they're highly precise, and may still be enough to accurately recapitulate organismal distribution and abundance.
Importantly, the authors note that you can't ignore computational requirements, which varied by orders of magnitude between methods. Selection of the right method depends on the goals (is sensitivity or precision more important?) and the available resources (time and compute power are never infinite - these are tangible limitations that are imposed in the real world).
This paper was first received at BMC Bioinformatics a year ago, and since then many new methods for sequence classification have been published. Further, this paper only evaluates methods for classification of unassembled reads, and does not evaluate methods that rely on metagenome assembly (that's the subject of another much longer post, but check out Titus Brown's blog for lots more on this topic).
Overall, this paper was a great demonstration of how one might attempt to evaluate many different tools ostensibly aimed at solving the same problem but functioning in completely different ways.
Bazinet, Adam L., and Michael P. Cummings. "A comparative evaluation of sequence classification programs." BMC Bioinformatics 13.1 (2012): 92.
A challenge in shotgun metagenomics analysis is the sequence classification problem: i.e., given a sequence, what's it's origin? I.e., did this sequence read come from E. coli or some other enteric bacteria? Note that sequence classification does not involve genome assembly - sequence classification is done on unassembled reads. If you could perfectly classify the origin of every sequence read in your sample, you would know exactly what organisms are in your environmental sample and how abundant each one is.
The solution to this problem isn't simply BLAST'ing every sequence read that comes off your HiSeq 2500 against NCBI nt/nr. The computational cost of this BLAST search would be many times more expensive than the sequencing itself. There are many algorithms for sequence classification. This paper examines a wide range of the available algorithms and software implementations for sequence classification as applied to metagenomic data:
Bazinet, Adam L., and Michael P. Cummings. "A comparative evaluation of sequence classification programs." BMC Bioinformatics 13.1 (2012): 92.
In this paper, the authors comprehensively evaluated the performance of over 25 programs that fall into three categories: alignment-based, composition-based, and phylogeny-based. For illustrative purposes, the authors constructed a "phylogenetic tree" that shows how each of the 25 methods they evaluated are related to each other:
 |
| Figure 1: Program clustering. A neighbor-joining tree that clusters the classification programs based on their similar attributes. |
The performance evaluation was done on several different datasets where the composition was known, using a similar set of evaluation criteria (sensitivity = number of correct assignments / number of sequences in the data; precision = number of correct assignments/number of assignments made). They concluded that the performance of particular methods varied widely between datasets due to reasons like highly variable taxonomic composition and diversity, level of sequence representation in underlying databases, read lengths, and read quality. The authors specifically point out that just because some methods lack sensitivity (as they've defined it), they are still useful because they have high precision. For example, marker-based approaches (like Metaphyler) might only classify a small number of reads, but they're highly precise, and may still be enough to accurately recapitulate organismal distribution and abundance.
Importantly, the authors note that you can't ignore computational requirements, which varied by orders of magnitude between methods. Selection of the right method depends on the goals (is sensitivity or precision more important?) and the available resources (time and compute power are never infinite - these are tangible limitations that are imposed in the real world).
This paper was first received at BMC Bioinformatics a year ago, and since then many new methods for sequence classification have been published. Further, this paper only evaluates methods for classification of unassembled reads, and does not evaluate methods that rely on metagenome assembly (that's the subject of another much longer post, but check out Titus Brown's blog for lots more on this topic).
Overall, this paper was a great demonstration of how one might attempt to evaluate many different tools ostensibly aimed at solving the same problem but functioning in completely different ways.
Bazinet, Adam L., and Michael P. Cummings. "A comparative evaluation of sequence classification programs." BMC Bioinformatics 13.1 (2012): 92.
"Document Design and Purpose, Not Mechanics"
If you ever write code for scientific computing (chances are you do if you're here), stop what you're doing and spend 8 minutes reading this open-access paper:
Wilson et al. Best Practices for Scientific Computing. arXiv:1210.0530 (2012). (Direct link to PDF).
The paper makes a number of good points regarding software as a tool just like any other lab equipment: it should be built, validated, and used as carefully as any other physical instrumentation. Yet most scientists who write software are self-taught, and haven't been properly trained in fundamental software development skills.
The paper outlines ten practices every computational biologist should adopt when writing code for research computing. Most of these are the usual suspects that you'd probably guess - using version control, workflow management, writing good documentation, modularizing code into functions, unit testing, agile development, etc. One that particularly jumped out at me was the recommendation to document design and purpose, not mechanics.
We all know that good comments and documentation is critical for code reproducibility and maintenance, but inline documentation that recapitulates the code is hardly useful. Instead, we should aim to document the underlying ideas, interface, and reasons, not the implementation.
For example, the following commentary is hardly useful:
# Increment the variable "i" by one.
i = i+1
The real recommendation here is that if your code requires such substantial documentation of the actual implementation to be understandable, it's better to spend the time rewriting the code rather than writing a lengthy description of what it does. I'm very guilty of doing this with R code, nesting multiple levels of functions and vector operations:
# It would take a paragraph to explain what this is doing.
# Better to break up into multiple lines of code.
sapply(data.frame(n=sapply(x, function(d) sum(is.na(d)))), function(dd) mean(dd))
It would take much more time to properly document what this is doing than it would take to split the operation into manageable chunks over multiple lines such that the code no longer needs an explanation. We're not playing code golf here - using fewer lines doesn't make you a better programmer.
The Pacific Symposium on Biocomputing 2013

For 18 years now, computational biologists have convened on the beautiful islands of Hawaii to present and discuss research emerging from new areas of biomedicine. PSB Conference Chairs Teri Klein (@teriklein), Keith Dunker, Russ Altman (@Rbaltman) and Larry Hunter (@ProfLHunter) organize innovative sessions and tutorials that are always interactive and thought-provoking. This year, sessions included Computational Drug Repositioning, Epigenomics, Aberrant Pathway and Network Activity, Personalized Medicine, Phylogenomics and Population Genomics, Post-Next Generation Sequencing, and Text and Data Mining. The Proceedings are available online here, and a few of the highlights are:
Cheng et al. examine various analytical methods for processing data from the Connectivity Map, a dataset of gene expression changes due to small molecule treatment. They compare methods for identifying drug-induced gene expression profiles to a benchmark based on the Anatomical Theraputic Chemical (ATC) system with the hope of discovering additional mechanisms of action.
Huang et al. developed a recursive K-means spectral clustering algorithm and applied this method to gene expression data from the Cancer Genome Atlas. It provides better cluster separation than traditional hierarchical clustering, and better execution time than similar K-means approaches.
Schrider et al. used pooled paired-end sequence data from multiple Drosophila melanogaster species along the eastern US coast to identify copy number variants under selective pressure. Many of the CNVs identified contain CYP enzymes likely influencing insecticide resistance. Schrider also pointed out in his talk that human salivary amylase (AMY1) has copy numbers that are differentiated across human populations due to differences in dietary starch content. Cool!
Verspoor et al. presented an awesome application of text mining to identify catalytic protein residues from the biomedical literature. Text mining tasks are always wrought with difficulties such as identifier ambiguity and resolution, or simply identifying the corpus of text needed for the task. Using Literature-Enhanced Automated Prediction of Functional Sites (LEAP-FS) and the Protein Data Bank (with Pubmed references), they compare their text mining approach to the Catalytic Site Atlas as a ‘silver standard’. Despite the difficulty, a simple classifier gives an accuracy around 70% (measured by F-statistic).
Also, my colleague Ting Hu presented her excellent work on statistical epistasis networks which use entropy-based measures to identify high-order interactions in genetic data. And in case you are interested, I’ll end by shamelessly listing our own publications in complex data analysis and rare-variant population structure (with Marylyn Ritchie), and performance of the Illumina Metabochip in Hispanic samples and high-throughput epidemiology (with Dana Crawford).
PSB is always a fantastic meeting – hope to see you in 2014!
Getting Genetics Done 2012 In Review
Here are links to all of this year's posts (excluding seminar/webinar announcements), with the most visited posts in bold italic. As always, you can follow me on Twitter for more frequent updates. Happy new year!
New Year's Resolution: Learn How to Code
Annotating limma Results with Gene Names for Affy Microarrays
Your Publications (with PMCID) as a PubMed Query
Pathway Analysis for High-Throughput Genomics Studies
find | xargs ... Like a Boss
Redesign by Subtraction
Video Tip: Convert Gene IDs with Biomart
RNA-Seq Methods & March Twitter Roundup
Awk Command to Count Total, Unique, and the Most Abundant Read in a FASTQ file
Video Tip: Use Ensembl BioMart to Quickly Get Ortholog Information
Stepping Outside My Open-Source Comfort Zone: A First Look at Golden Helix SVS
How to Stay Current in Bioinformatics/Genomics
The HaploREG Database for Functional Annotation of SNPs
Identifying Pathogens in Sequencing Data
Browsing dbGAP Results
Fix Overplotting with Colored Contour Lines
Plotting the Frequency of Twitter Hashtag Usage Over Time with R and ggplot2
Cscan: Finding Gene Expression Regulators with ENCODE ChIP-Seq Data
More on Exploring Correlations in R
DESeq vs edgeR Comparison
Learn R and Python, and Have Fun Doing It
STAR: ultrafast universal RNA-seq aligner
RegulomeDB: Identify DNA Features and Regulatory Elements in Non-Coding Regions
Copy Text to the Local Clipboard from a Remote SSH Session
Differential Isoform Expression With RNA-Seq: Are We Really There Yet?
New Year's Resolution: Learn How to Code
Annotating limma Results with Gene Names for Affy Microarrays
Your Publications (with PMCID) as a PubMed Query
Pathway Analysis for High-Throughput Genomics Studies
find | xargs ... Like a Boss
Redesign by Subtraction
Video Tip: Convert Gene IDs with Biomart
RNA-Seq Methods & March Twitter Roundup
Awk Command to Count Total, Unique, and the Most Abundant Read in a FASTQ file
Video Tip: Use Ensembl BioMart to Quickly Get Ortholog Information
Stepping Outside My Open-Source Comfort Zone: A First Look at Golden Helix SVS
How to Stay Current in Bioinformatics/Genomics
The HaploREG Database for Functional Annotation of SNPs
Identifying Pathogens in Sequencing Data
Browsing dbGAP Results
Fix Overplotting with Colored Contour Lines
Plotting the Frequency of Twitter Hashtag Usage Over Time with R and ggplot2
Cscan: Finding Gene Expression Regulators with ENCODE ChIP-Seq Data
More on Exploring Correlations in R
DESeq vs edgeR Comparison
Learn R and Python, and Have Fun Doing It
STAR: ultrafast universal RNA-seq aligner
RegulomeDB: Identify DNA Features and Regulatory Elements in Non-Coding Regions
Copy Text to the Local Clipboard from a Remote SSH Session
Differential Isoform Expression With RNA-Seq: Are We Really There Yet?
Differential Isoform Expression With RNA-Seq: Are We Really There Yet?
In case you missed it, a new paper was published in Nature Biotechnology on a method for detecting isoform-level differential expression with RNA-seq Data:
Trapnell, Cole, et al. "Differential analysis of gene regulation at transcript resolution with RNA-seq." Nature Biotechnology (2012).
THE PROBLEM
Trapnell, Cole, et al. "Differential analysis of gene regulation at transcript resolution with RNA-seq." Nature Biotechnology (2012).
THE PROBLEM
RNA-seq enables transcript-level resolution of gene expression, but there is no proven methodology for simultaneously accounting for biological variability across replicates and uncertainty in mapping fragments to isoforms. One of the most commonly used workflows is to map reads with a tool like Tophat or STAR, use a tool like HTSeq to count the number of reads overlapping a gene, then use a negative-binomial count-based approach such as edgeR or DESeq to assess differential expression at the gene level.
Figure 1 in the paper illustrates the problem with existing approaches, which only count the number of fragments originating from either the entire gene or constitutive exons only.
 |
| Excerpt from figure 1 from the Cuffdiff 2 paper. |
In the top row, a change in gene expression is undetectable by counting reads mapping to any exon, and is underestimated if counting only constitutive exons. In the middle row, an apparent change would be detected, but in the wrong direction if using a count-based method alone rather than accounting for which transcript a read comes from and how long that transcript is. How often situations like the middle row happen in reality, that's anyone's guess.
THE PROPOSED SOLUTION
The method presented in this paper, popularized by the cuffdiff method in the Cufflinks software package, claims to address both of these problems simultaneously by modeling variability in the number of fragments generated by each transcript across biological replicates using a beta negative binomial mixture distribution that accounts for both sources of variability in a transcript's measured expression level. This so-called transcript deconvolution is not computationally trivial, and incredibly difficult to explain, but failure to account for the uncertainty (measurement error) from which transcript a fragment originates from can result in a high false-positive rate, especially when there is significant differential regulation of isoforms. Compared to existing methods, the procedure described claims equivalent sensitivity with a much lower false-positive rate when there is substantial isoform-level variability in gene expression between conditions.
ALTERNATIVE WORKFLOWS
Importantly, the manuscript also addresses and points out weaknesses several undocumented "alternative" workflows that are discussed often on forums like SEQanswers and anecdotally at meetings. These alternative workflows are variations on a theme: combining transcript-level fragment count estimates (like estimates from Cufflinks, eXpress, or RSEM mapping to a transcriptome), with downstream count-based analysis tools like edgeR/DESeq (both R/Bioconductor packages). This paper points out that none of these tools were meant to be used this way, and doing so violates assumptions of underlying statistics used by both procedures. However, the authors concede that the variance modeling strategies of edgeR and DESeq are robust, and thus assessed the performance of these "alternative" workflows. The results of those experiments show that the algorithm presented in this paper, cuffdiff 2, outperforms other alternative hybrid Cufflinks/RSEM + edgeR/DESeq workflows [see supplementary figure 77 (yes, 77!]).
REPRODUCIBILITY ISSUES
In theory (and in the simulation studies presented here, see further comments below), the methodology presented here seems to outperform any other competing workflow. So why isn't everyone using it, and why is there so much grumbling about it on forums and at meetings? For many (myself included), the biggest issue is one of reproducibility. There are many discussions about cufflinks/cuffdiff providing drastically different results from one version to the next (see here, here, here, here, and here, for a start). The core I run operates in a production environment where everything I do must be absolutely transparent and reproducible. Reporting drastically different results to my collaborators whenever I update the tools I'm using is very alarming to a biologist, and reduces their confidence in the service I provide and the tools I use.
Furthermore, a recent methods paper recently compared their tool, DEXSeq, to several different versions of cuffdiff. Here, the authors performed two comparisons: a "proper" comparison, where replicates of treatments (T1-T3) were compared to replicates of controls (C1-C4), and a "mock" comparison, where controls (e.g. C1+C3) were compared to other controls (C2+C4). The most haunting result is shown below, where the "proper" comparison finds relatively few differentially expressed genes, while the "mock" comparison of controls versus other controls finds many, many more differentially expressed genes, and an increasing number with newer versions of cufflinks:
 |
| Table S1 from the DEXSeq paper. |
This comparison predates the release of Cuffdiff 2, so perhaps this alarming trend ceases with the newer release of Cufflinks. However, it is worth noting that these data shown here are from a real dataset, where all the comparisons in the new Cuffdiff 2 paper were done with simulations. Having done some method development myself, I realize how easy it is to construct a simulation scenario to support nearly any claim you'd like to make.
FINAL THOUGHTS
Most RNA-seq folks would say that the field has a good handle on differential expression at the gene level, while differential expression at isoform-level resolution is still under development. I would tend to agree with this statement, but if cases as presented in Figure 1 of this paper are biologically important and widespread (they very well may be), then perhaps we have some re-thinking to do, even with what we thought were "simple" analyses at the gene level.
What's your workflow for RNA-seq analysis? Discuss.
Cscan: Finding Gene Expression Regulators with ENCODE ChIP-Seq Data
Recently published in Nucleic Acids Research:
F. Zambelli, G. M. Prazzoli, G. Pesole, G. Pavesi, Cscan: finding common regulators of a set of genes by using a collection of genome-wide ChIP-seq datasets., Nucleic acids research 40, W510–5 (2012).
 |
| Cscan web interface screenshot |
This paper presents a methodology and software implementation that allows users to discover a set of transcription factors or epigenetic modifications that regulate a set of genes of interest. A wealth of data about transcription factor binding exists in the public domain, and this is a good example of a group utilizing those resources to develop tools that are of use to the broader computational biology community.
High-throughput gene expression experiments like microarrays and RNA-seq experiments often result in a list of differentially regulated or co-expressed genes. A common follow-up question asks which transcription factors may regulate those genes of interest. The ENCODE project has completed ChIP-seq experiments for many transcription factors and epigenetic modifications for a number of different cell lines in both human and model organisms. These researchers crossed this publicly available data on enriched regions from ChIP-seq experiments with genomic coordinates of gene annotations to create a table of gene annotations (rows) by ChIP-peak signals, with a presence/absence peak in each cell. Given a set of genes of interest (e.g. differentially regulated genes from an RNA-seq experiment), the method evaluates the over-/under-representation of target sites for the DNA binding protein in each ChIP experiment using a Fisher's exact test. Other methods based on motif-enrichment (using position weight matrices derived from databases like TRANSFAC or JASPAR) would miss DNA-binding factors like the Retinoblastoma protein (RB), which lacks a DNA-binding domain and is recruited to promoters by other transcription factors. In addition to overcoming this limitation, the method presented here also has the advantage of considering tissue-specificity and chromatin accessibility.
The web interface is free and doesn't require registration: http://www.beaconlab.it/cscan
How to Stay Current in Bioinformatics/Genomics
A few folks have asked me how I get my news and stay on top of what's going on in my field, so I thought I'd share my strategy. With so many sources of information begging for your attention, the difficulty is not necessarily finding what's interesting, but filtering out what isn't. What you don't read is just as important as what you do, so when it comes to things like RSS, Twitter, and especially e-mail, it's essential to filter out sources where the content consistently fails to be relevant or capture your interest. I run a bioinformatics core, so I'm more broadly interested in applied methodology and study design rather than any particular phenotype, model system, disease, or method. With that in mind, here's how I stay current with things that are relevant to me. Please leave comments with what you're reading and what you find useful that I omitted here.
RSS
I get the majority of my news from RSS feeds from blogs and journals in my field. I spend about 15 minutes per day going through headlines from the following sources:
Journals. Most journals have separate RSS feeds for their current table of contents as well as their advance online ahead-of-print articles.
Mailing lists
I prefer to keep work and personal email separate, but I have all my mailing list email sent to my Gmail because Gmail's search is better than any alternative. I have a filter set up to automatically filter and tag mailing list digests under a "Work" label so I can get to them (or filter them from my inbox) easily.
RSS
I get the majority of my news from RSS feeds from blogs and journals in my field. I spend about 15 minutes per day going through headlines from the following sources:
Journals. Most journals have separate RSS feeds for their current table of contents as well as their advance online ahead-of-print articles.
- Bioinformatics - RSS feed of current and advance online publications
- Genome Research - current & advance
- Genome Biology - editors picks, latest, most viewed, most forwarded. (Hit the RSS icon under each tab).
- PLoS Genetics - new articles
- PLoS Computational Biology - new articles
- Nature Genetics - current TOC and AOP
- Nature Reviews Genetics - current TOC and AOP
- The OpenHelix Blog
- Ensembl blog
- Galaxy News
- Blue Collar Bioinformatics
- Homologus
- Golden Helix - our 2 SNPs
- Genomics Law Report
- R-bloggers (aggregates feeds from >350 blogs about R)
- Genomes Unzipped
- Jason Moore's Epistasis Blog
- 23andMe - the Spitoon
Mailing lists
I prefer to keep work and personal email separate, but I have all my mailing list email sent to my Gmail because Gmail's search is better than any alternative. I have a filter set up to automatically filter and tag mailing list digests under a "Work" label so I can get to them (or filter them from my inbox) easily.
- Bioconductor (daily digest)
- Galaxy mailing lists. I subscribe to the -announce, -user, and -dev mailing lists, but I have a Gmail filter set up to automatically skip the inbox and mark read messages from the -user and -dev lists. I don't care to look at these every day, but again, it's handy to be able to use Gmail's search functionality to look through old mailing list responses.
Email Alerts & Subscriptions
Again, email can get out of hand sometimes, so I prefer to only have things that I really don't want to miss sent to my email. The rest I use RSS.
- SeqAnswers subscriptions. When I ask a question or find a question that's relevant to something I'm working on, I subscribe to that thread for email alerts whenever a new response is posted.
- Google Scholar alerts. I have alerts set up to send me emails based on certain topics (e.g. [ rna-seq | transcriptome sequencing | RNA-sequencing ] or [ intitle:"chip-seq" ]), or when certain people publish (e.g. ["ritchie md" & vanderbilt]). I also use this to alert me when certain consortia publish (e.g. ["Population Architecture using Genomics and Epidemiology"]).
- PubMed Saved Searches using MyNCBI, because Google Scholar doesn't catch everything. I have alerts set up for RNA-seq, ChIP-Seq, bioinformatics methods, etc.
- GenomeWeb subscriptions. Most of these are once per week, except Daily Scan. I subscribe to Daily Scan, Genome Technology, BioInform, Clinical Sequencing News, In Sequence, and Pharmacogenomics Reporter. BioInform has a "Bioinformatics Papers of Note", and In Sequence has a "Sequencing papers of note" column in every issue. These are good for catching things I might have missed with the Scholar and Pubmed alerts.
Twitter
99.9% of Twitter users have way too much time on their hands, but when used effectively, Twitter can be incredibly powerful for both consuming and contributing to the dialogue in your field. Twitter can be an excellent real-time source of new publications, fresh developments, and current opinion, but it can also quickly become a time sink. I can tolerate an occasional Friday afternoon humorous digression, but as soon as off-topic tweets become regular it's time to unfollow. The same is true with groups/companies - some deliver interesting and broadly applicable content (e.g. 23andMe), while others are purely a failed attempt at marketing while not offering any substantive value to their followers. A good place to start is by (shameless plug) following me or the people I follow (note: this isn't an endorsement of anyone on this list, and there are a few off-topic people I follow for my non-work interests). I can't possibly list everyone, but a few folks who tweet consistently on-topic and interesting content are: Daniel MacArthur, Jason Moore, Dan Vorhaus, 23andMe, OpenHelix, Larry Parnell, Francis Ouellette, Leonid Kruglyak, Sean Davis, Joe Pickrell, The Galaxy Project, J. Chris Pires, Nick Loman, and Andrew Severin. Also, a hashtag in twitter (prefixed by the #), is used to mark keywords or topics in Twitter. I occasionally browse through the #bioinformatics and #Rstats hashtag.
Guide to RNA-seq Analysis in Galaxy
James Taylor came to UVA last week and gave an excellent talk on how Galaxy enables transparent and reproducible research in genomics. I'm gearing up to take on several projects that involve next-generation sequencing, and I'm considering installing my own Galaxy framework on a local cluster or on the cloud.
If you've used Galaxy in the past you're probably aware that it allows you to share data, workflows, and histories with other users. New to me was the pages section, where an entire analysis is packaged on a single pages, and vetting is crowdsourced to other Galaxy users in the form of comments and voting.
I recently found a page published by Galaxy user Jeremy that serves as a guide to RNA-seq analysis using Galaxy. If you've never done RNA-seq before it's a great place to start. The guide has all the data you need to get started on an experiment where you'll use TopHat/Bowtie to align reads to a reference genome, and Cufflinks to assemble transcripts and quantify differential gene expression, alternative splicing, etc. The dataset is small, so all the analyses start and finish quickly, allowing you to finish the tutorial in just a few hours. The author was kind enough to include links to relevant sections of the TopHat and Cufflinks documentation where it's needed in the tutorial. Hit the link below to get started.
Galaxy Pages: RNA-seq Analysis Exercise
If you've used Galaxy in the past you're probably aware that it allows you to share data, workflows, and histories with other users. New to me was the pages section, where an entire analysis is packaged on a single pages, and vetting is crowdsourced to other Galaxy users in the form of comments and voting.
I recently found a page published by Galaxy user Jeremy that serves as a guide to RNA-seq analysis using Galaxy. If you've never done RNA-seq before it's a great place to start. The guide has all the data you need to get started on an experiment where you'll use TopHat/Bowtie to align reads to a reference genome, and Cufflinks to assemble transcripts and quantify differential gene expression, alternative splicing, etc. The dataset is small, so all the analyses start and finish quickly, allowing you to finish the tutorial in just a few hours. The author was kind enough to include links to relevant sections of the TopHat and Cufflinks documentation where it's needed in the tutorial. Hit the link below to get started.
Galaxy Pages: RNA-seq Analysis Exercise
My thoughts on ICHG 2011

On Wednesday, Marylyn Ritchie(@MarylynRitchie) and Nancy Cox organized “Beyond Genome-wide association studies”. Nancy Cox presented some ideas on how to integrate multiple “intermediate” associations for SNPs, such as expression QTLs and newly discovered protein QTLs (More on pQTLs later). This approach which she called a Functional Unit Analysis would group signals together based on the genes they influence. Nicholas Shork presented some nice examples of pros and cons of sequence level annotation algorithms. Trey Idekker gave a very nice talk illustrating some of the properties of epistasis in yeast protein interaction networks. One of the more striking points he made was that epistasis tends to occur between full protein complexes rather than within elements of the complexes themselves. Marylyn Ritchie presented the ideas behind her ATHENA software for machine learning analysis of genetic data, and Manuel Mattesian from Tim Becker’s group presented the methods in their INTERSNP software for doing large-scale interaction analysis. What was most impressive with this session is that there were clear attempts to incorporate underlying biological complexity into data analysis.
On Thursday, I attended the second Statistical Genetics section called “Expanding Genome-wide Association Studies”, organized by Saurabh Ghosh and Daniel Shriner. Having recently attended IGES, I feel pretty “up” on newer analysis techniques, but this session had a few talks that sparked my interest. The first three talks were related to haplotype phasing and the issues surrounding computational accuracy and speed. The basic goal of all these methods is to efficiently estimate genotypes for a common set of loci for all samples of a study using a set of reference haplotypes, usually from the HapMap or 1000 genomes data. Despite these advances, it seems like phasing haplotypes for thousands of samples is still a massive undertaking that requires a high-performance computing cluster. There were several talks about ongoing epidemiological studies, including the Kaiser Permanente UCSF cohort. Neil Risch presented an elegant study design implementing four custom GWAS chips for the four targeted populations. Looks like the data hasn't started to flow from this yet, but when it does we’re sure to learn about lots of interesting ethnic-specific disease effects. My good friend and colleague Dana Crawford presented an in silico GWAS study of hypothyroidism. In her best NPR voice, Dana showed how electronic medical records with GWAS data in the EMERGE network can be re-used to construct entirely new studies nested within the data collected for other specific disease purposes. Her excellent Post-Doc, Logan Dumitrescu presented several gene-environment interactions between Lipid levels and vitamin A and E from Dana’s EAGLE study. Finally Paul O’Reilly presented a cool new way to look at multiple phenotypes by essentially flipping a typical regression equation around, estimating coefficients that relate each phenotype in a study to a single SNP genotype as an outcome. This rather clever approach called MultiPhen is similar to log-linear models I’ve seen used for transmission-based analysis, and allows you to model the “interaction” among phenotypes in much the same way you would look at SNP interactions.
By far the most interesting talks of the meeting (for me) were in the Genomics section on Gene Expression, organized by Tomi Pastinen and Mark Corbett. Chris Mason started the session off with a fantastic demonstration of the power of RNA-seq. Examining transcriptomes of 14 non-human primate species, they validated many of the computational predictions in the AceView gene build, and illustrated that most “exome” sequencing is probably examining less than half of all transcribed sequences. Rupali Patwardhan talked about a system for examining the impact of promoter and enhancer mutations in whole mice, essentially using mutagenesis screens to localize these regions. Ron Hause presented work on the protein QTLs that Nancy Cox alluded to earlier in the conference. Using a high-throughput form of western blots, they systematically examined levels for over 400 proteins in the Yoruba HapMap cell lines. They also illustrate that only about 50% of eQTLs identified in these lines actually alter protein levels. Stephen Montgomery spoke about the impact of rare genetic variants within a transcript on transcript levels. Essentially he showed an epistatic effect on expression, where transcripts with deleterious alleles are less likely to be expressed – an intuitive and fascinating finding, especially for those considering rare-variant analysis. Athma Pai presented a new QTL that influences mRNA decay rates. By measuring multiple time points using RNA-seq, she found individual-level variants that alter decay, which she calls dQTLs. Veronique Adoue looked at cis-eQTLs relative to transcription factor binding sites using ChIP, and Alfonso Buil showed how genetic variants influence gene expression networks (or correlation among gene expression) across tissue types.
I must say despite all the awesome work presented in this session, Michael Snyder stole the show with his talk on the “Snyderome” – his own personal –omics profile collected over 21 months. His whole-genome was sequenced by Complete Genomics, and processed using Rong Chen and Atul Butte’s risk-o-gram to quantify his disease risk. His profile predicted increased risk of T2D, so he began collecting glucose measures and low and behold, he saw a sustained spike in blood glucose levels following a few days following a common cold. His interpretation was that an environmental stress knocked him into a pseudo-diabetic state, and his transcriptome and proteome results corroborated this idea. Granted, this is an N of 1, and there is still lots of work to be done before this type of analysis revolutionizes medicine, but the take home message is salient – multiple -omics are better than one, and everyone’s manifestation of a complex disease is different. This was truly thought-provoking work, and it nicely closed an entire session devoted to understanding the intermediate impact of genetic variants to better understand disease complexity.
This is just my take of a really great meeting -- I'm sure I missed lots of excellent talks. If you saw something good please leave a comment and share!
True Hypotheses are True, False Hypotheses are False
I just read Gregory Cooper and Jay Shendure's review "Needles in stacks of needles: finding disease-causal variants in a wealth of genomic data" in Nature Reviews Genetics. It's a good review about how to narrow down deleterious disease-causing variants from many, many variants throughout the genome when statistics and genetic information alone isn't enough.
I really liked how they framed the multiple-testing problem that routinely plagues large-scale genetic studies, where nominal significance thresholds can yield many false positives when applied to multiple hypothesis tests:
Check out the full review at Nature Reviews Genetics:
Needles in stacks of needles: finding disease-causal variants in a wealth of genomic data
I really liked how they framed the multiple-testing problem that routinely plagues large-scale genetic studies, where nominal significance thresholds can yield many false positives when applied to multiple hypothesis tests:
However, true hypotheses are true, and false hypotheses are false, regardless of how many are tested. As such, the actual 'multiple testing burden' depends on the proportion of true and false hypotheses in any given set: that is, the 'prior probability' that any given hypothesis is true, rather than the number of tests per se. This challenge can thus be viewed as a 'naive hypothesis testing' problem — that is, when in reality only one or a few variants are causal for a given phenotype, but all (or many) variants are a priori equally likely candidates, the prior probability of any given variant being causal is miniscule. As a consequence, extremely convincing data are required to support causality, which is potentially unachievable for some true positives.
Defining the challenge in terms of hypothesis quality rather than quantity, however, points to a solution. Specifically, experimental or computational approaches that provide assessments of variant function can be used to better estimate the prior probability that any given variant is phenotypically important, and these approaches thereby boost discovery power.
Check out the full review at Nature Reviews Genetics:
Needles in stacks of needles: finding disease-causal variants in a wealth of genomic data
Estimating Trait Heritability from GWAS Data
Peter Visscher and colleagues have recently published a flurry of papers employing a new software package called GCTA to estimate the heritability of traits using GWAS data (GCTA stands for Genome-wide Complex Trait Analysis -- clever acronymity!). The tool, supported (and presumably coded) by Jian Yang is remarkably easy to use, based in part on the familiar PLINK commandline interface. The GCTA Homepage provides an excellent walk-through of the available options.
The basic idea is to use GWAS data to estimate the degree of "genetic sharing" or relatedness among the samples, computing what the authors call a genetic relationship matrix (GRM). The degree of genetic sharing among samples is then related to the amount of phenotypic sharing using restricted maximum likelihood analysis (REML). The result is an estimate of the variance explained by the SNPs used to generate the GRM. Full details of the stats along with all the gory matrix notation can be found in their software publication.
The approach has been applied to several disorders studied by the WTCCC and to a recent study of human height. Interestingly, the developers have also used the approach to partition the trait variance across chromosomes, resulting in something similar to population-based variance-components linkage analysis. The approach works for both quantitative and dichotomous traits, however the authors warn that variance estimates of dichotomous trait liability are influenced by genotyping artifacts.
The package also includes several other handy features, including a relatively easy way to estimate principal components for population structure correction, a GWAS simulation tool, and a regression-based LD mapping tool. Download and play -- a binary is available for Linux, MacOS, and DOS/Windows.
The basic idea is to use GWAS data to estimate the degree of "genetic sharing" or relatedness among the samples, computing what the authors call a genetic relationship matrix (GRM). The degree of genetic sharing among samples is then related to the amount of phenotypic sharing using restricted maximum likelihood analysis (REML). The result is an estimate of the variance explained by the SNPs used to generate the GRM. Full details of the stats along with all the gory matrix notation can be found in their software publication.
The approach has been applied to several disorders studied by the WTCCC and to a recent study of human height. Interestingly, the developers have also used the approach to partition the trait variance across chromosomes, resulting in something similar to population-based variance-components linkage analysis. The approach works for both quantitative and dichotomous traits, however the authors warn that variance estimates of dichotomous trait liability are influenced by genotyping artifacts.
The package also includes several other handy features, including a relatively easy way to estimate principal components for population structure correction, a GWAS simulation tool, and a regression-based LD mapping tool. Download and play -- a binary is available for Linux, MacOS, and DOS/Windows.
Friday Links: R, OpenHelix Bioinformatics Tips, 23andMe, Perl, Python, Next-Gen Sequencing
I haven't posted much here recently, but here is a roundup of a few of the links I've shared on Twitter (@genetics_blog) over the last two weeks.
Here is a nice tutorial on accessing high-throughput public data (from NCBI) using R and Bioconductor.
Cloudnumbers.com, a startup that allows you to run high-performance computing (HPC) applications in the cloud, now supports the previously mentioned R IDE, RStudio.
23andMe announced a project to enroll 10,000 African-Americans for research by giving participants their personal genome service for free. You can read about it here at 23andMe or here at Genetic Future.
Speaking of 23andMe, they emailed me a coupon code (8WR9U9) for getting $50 off their personal genome service, making it $49 instead of $99. Not sure how long it will last.
I previously took a poll which showed that most of you use Mendeley to manage your references. Mendeley recently released version 1.0, which includes some nice features like duplicate detection, better library organization (subfolders!), and a better file organization tool. You can download it here.
An interesting blog post by Michael Barton on how training and experience in bioinformatics leads to a wide set of transferable skills.
Dienekes releases a free DIY admixture program to analyze genomic ancestry.
A few tips from OpenHelix: the new SIB Bioinformatics Resource Portal, and testing correlation between SNPs and gene expression using SNPexp.
A nice animation describing a Circos plot from PacBio's E. coli paper in NEJM.
The Court of Appeals for the Federal Circuit reversed the lower court's invalidation of Myriad Genetics' patents on BRCA1/2, reinstating most of the claims in full force. Thoughtful analysis from Dan Vorhaus here.
Using the Linux shell and perl to delete files in the current directory that don't contain the right number of lines: If you want to get rid of all files in the current directory that don't have exactly 42 lines, run this code at the command line (*be very careful with this one!*): for f in *.txt;do perl -ne 'END{unlink $ARGV unless $.==42}' ${f} ;done
The previously mentioned Hitchhiker's Guide to Next-Generation Sequencing by Gabe Rudy at Golden Helix is now available in PDF format here. You can also find the related post describing all the various file formats used in NGS in PDF format here.
The Washington Post ran an article about the Khan Academy (http://www.khanacademy.org/), which has thousands of free video lectures, mostly on math. There are also a few computer science lectures that teach Python programming. (Salman Khan also appeared on the Colbert Report a few months ago).
Finally, I stumbled across this old question on BioStar with lots of answers about methods for short read mapping with next-generation sequencing data.
...
And here are a few interesting papers I shared:
Nature Biotechnology: Structural variation in two human genomes mapped at single-nucleotide resolution by whole genome de novo assembly
PLoS Genetics: Gene-Based Tests of Association
PLoS Genetics: Fine Mapping of Five Loci Associated with Low-Density Lipoprotein Cholesterol Detects Variants That Double the Explained Heritability
Nature Reviews Genetics: Systems-biology approaches for predicting genomic evolution
Genome Research: A comprehensively molecular haplotype-resolved genome of a European individual (paper about the importance of phase in genetic studies)
Nature Reviews Microbiology: Unravelling the effects of the environment and host genotype on the gut microbiome.
...
Here is a nice tutorial on accessing high-throughput public data (from NCBI) using R and Bioconductor.
Cloudnumbers.com, a startup that allows you to run high-performance computing (HPC) applications in the cloud, now supports the previously mentioned R IDE, RStudio.
23andMe announced a project to enroll 10,000 African-Americans for research by giving participants their personal genome service for free. You can read about it here at 23andMe or here at Genetic Future.
Speaking of 23andMe, they emailed me a coupon code (8WR9U9) for getting $50 off their personal genome service, making it $49 instead of $99. Not sure how long it will last.
I previously took a poll which showed that most of you use Mendeley to manage your references. Mendeley recently released version 1.0, which includes some nice features like duplicate detection, better library organization (subfolders!), and a better file organization tool. You can download it here.
An interesting blog post by Michael Barton on how training and experience in bioinformatics leads to a wide set of transferable skills.
Dienekes releases a free DIY admixture program to analyze genomic ancestry.
A few tips from OpenHelix: the new SIB Bioinformatics Resource Portal, and testing correlation between SNPs and gene expression using SNPexp.
A nice animation describing a Circos plot from PacBio's E. coli paper in NEJM.
The Court of Appeals for the Federal Circuit reversed the lower court's invalidation of Myriad Genetics' patents on BRCA1/2, reinstating most of the claims in full force. Thoughtful analysis from Dan Vorhaus here.
Using the Linux shell and perl to delete files in the current directory that don't contain the right number of lines: If you want to get rid of all files in the current directory that don't have exactly 42 lines, run this code at the command line (*be very careful with this one!*): for f in *.txt;do perl -ne 'END{unlink $ARGV unless $.==42}' ${f} ;done
The previously mentioned Hitchhiker's Guide to Next-Generation Sequencing by Gabe Rudy at Golden Helix is now available in PDF format here. You can also find the related post describing all the various file formats used in NGS in PDF format here.
The Washington Post ran an article about the Khan Academy (http://www.khanacademy.org/), which has thousands of free video lectures, mostly on math. There are also a few computer science lectures that teach Python programming. (Salman Khan also appeared on the Colbert Report a few months ago).
Finally, I stumbled across this old question on BioStar with lots of answers about methods for short read mapping with next-generation sequencing data.
...
And here are a few interesting papers I shared:
Nature Biotechnology: Structural variation in two human genomes mapped at single-nucleotide resolution by whole genome de novo assembly
PLoS Genetics: Gene-Based Tests of Association
PLoS Genetics: Fine Mapping of Five Loci Associated with Low-Density Lipoprotein Cholesterol Detects Variants That Double the Explained Heritability
Nature Reviews Genetics: Systems-biology approaches for predicting genomic evolution
Genome Research: A comprehensively molecular haplotype-resolved genome of a European individual (paper about the importance of phase in genetic studies)
Nature Reviews Microbiology: Unravelling the effects of the environment and host genotype on the gut microbiome.
...
Nucleic Acids Research Web Server Issue
Nucleic Acids Research just published its Web Server Issue, featuring new and updates to existing web servers and applications for genomics and proteomics research. In case you missed it, be sure to check out the Database Issue that came out earlier this year.
This web server issue has lots of papers on tools for microRNA analysis, and protein/RNA secondary structure analysis and annotation. Here are a few that sounded interesting for those doing systems genomics and trying to put findings into a functional, biologically relevant context:
g:Profiler—a web server for functional interpretation of gene lists (2011 update)
Abstract: Functional interpretation of candidate gene lists is an essential task in modern biomedical research. Here, we present the 2011 update of g:Profiler (http://biit.cs.ut.ee/gprofiler/), a popular collection of web tools for functional analysis. g:GOSt and g:Cocoa combine comprehensive methods for interpreting gene lists, ordered lists and list collections in the context of biomedical ontologies, pathways, transcription factor and microRNA regulatory motifs and protein–protein interactions. Additional tools, namely the biomolecule ID mapping service (g:Convert), gene expression similarity searcher (g:Sorter) and gene homology searcher (g:Orth) provide numerous ways for further analysis and interpretation. In this update, we have implemented several features of interest to the community: (i) functional analysis of single nucleotide polymorphisms and other DNA polymorphisms is supported by chromosomal queries; (ii) network analysis identifies enriched protein–protein interaction modules in gene lists; (iii) functional analysis covers human disease genes; and (iv) improved statistics and filtering provide more concise results. g:Profiler is a regularly updated resource that is available for a wide range of species, including mammals, plants, fungi and insects.
KOBAS 2.0: a web server for annotation and identification of enriched pathways and diseases
Abstract: High-throughput experimental technologies often identify dozens to hundreds of genes related to, or changed in, a biological or pathological process. From these genes one wants to identify biological pathways that may be involved and diseases that may be implicated. Here, we report a web server, KOBAS 2.0, which annotates an input set of genes with putative pathways and disease relationships based on mapping to genes with known annotations. It allows for both ID mapping and cross-species sequence similarity mapping. It then performs statistical tests to identify statistically significantly enriched pathways and diseases. KOBAS 2.0 incorporates knowledge across 1327 species from 5 pathway databases (KEGG PATHWAY, PID, BioCyc, Reactome and Panther) and 5 human disease databases (OMIM, KEGG DISEASE, FunDO, GAD and NHGRI GWAS Catalog). KOBAS 2.0 can be accessed at http://kobas.cbi.pku.edu.cn.
ICSNPathway: identify candidate causal SNPs and pathways from genome-wide association study by one analytical framework
Abstract: Genome-wide association study (GWAS) is widely utilized to identify genes involved in human complex disease or some other trait. One key challenge for GWAS data interpretation is to identify causal SNPs and provide profound evidence on how they affect the trait. Currently, researches are focusing on identification of candidate causal variants from the most significant SNPs of GWAS, while there is lack of support on biological mechanisms as represented by pathways. Although pathway-based analysis (PBA) has been designed to identify disease-related pathways by analyzing the full list of SNPs from GWAS, it does not emphasize on interpreting causal SNPs. To our knowledge, so far there is no web server available to solve the challenge for GWAS data interpretation within one analytical framework. ICSNPathway is developed to identify candidate causal SNPs and their corresponding candidate causal pathways from GWAS by integrating linkage disequilibrium (LD) analysis, functional SNP annotation and PBA. ICSNPathway provides a feasible solution to bridge the gap between GWAS and disease mechanism study by generating hypothesis of SNP → gene → pathway(s). The ICSNPathway server is freely available at http://icsnpathway.psych.ac.cn/.
AnnotQTL: a new tool to gather functional and comparative information on a genomic region
Abstract: AnnotQTL is a web tool designed to aggregate functional annotations from different prominent web sites by minimizing the redundancy of information. Although thousands of QTL regions have been identified in livestock species, most of them are large and contain many genes. This tool was therefore designed to assist the characterization of genes in a QTL interval region as a step towards selecting the best candidate genes. It localizes the gene to a specific region (using NCBI and Ensembl data) and adds the functional annotations available from other databases (Gene Ontology, Mammalian Phenotype, HGNC and Pubmed). Both human genome and mouse genome can be aligned with the studied region to detect synteny and segment conservation, which is useful for running inter-species comparisons of QTL locations. Finally, custom marker lists can be included in the results display to select the genes that are closest to your most significant markers. We use examples to demonstrate that in just a couple of hours, AnnotQTL is able to identify all the genes located in regions identified by a full genome scan, with some highlighted based on both location and function, thus considerably increasing the chances of finding good candidate genes. AnnotQTL is available at http://annotqtl.genouest.org.
Génie: literature-based gene prioritization at multi genomic scale
Abstract: Biomedical literature is traditionally used as a way to inform scientists of the relevance of genes in relation to a research topic. However many genes, especially from poorly studied organisms, are not discussed in the literature. Moreover, a manual and comprehensive summarization of the literature attached to the genes of an organism is in general impossible due to the high number of genes and abstracts involved. We introduce the novel Génie algorithm that overcomes these problems by evaluating the literature attached to all genes in a genome and to their orthologs according to a selected topic. Génie showed high precision (up to 100%) and the best performance in comparison to other algorithms in most of the benchmarks, especially when high sensitivity was required. Moreover, the prioritization of zebrafish genes involved in heart development, using human and mouse orthologs, showed high enrichment in differentially expressed genes from microarray experiments. The Génie web server supports hundreds of species, millions of genes and offers novel functionalities. Common run times below a minute, even when analyzing the human genome with hundreds of thousands of literature records, allows the use of Génie in routine lab work. Availability: http://cbdm.mdc-berlin.de/tools/genie/.
Nucleic Acids Research: Web Server Issue
This web server issue has lots of papers on tools for microRNA analysis, and protein/RNA secondary structure analysis and annotation. Here are a few that sounded interesting for those doing systems genomics and trying to put findings into a functional, biologically relevant context:
g:Profiler—a web server for functional interpretation of gene lists (2011 update)
Abstract: Functional interpretation of candidate gene lists is an essential task in modern biomedical research. Here, we present the 2011 update of g:Profiler (http://biit.cs.ut.ee/gprofiler/), a popular collection of web tools for functional analysis. g:GOSt and g:Cocoa combine comprehensive methods for interpreting gene lists, ordered lists and list collections in the context of biomedical ontologies, pathways, transcription factor and microRNA regulatory motifs and protein–protein interactions. Additional tools, namely the biomolecule ID mapping service (g:Convert), gene expression similarity searcher (g:Sorter) and gene homology searcher (g:Orth) provide numerous ways for further analysis and interpretation. In this update, we have implemented several features of interest to the community: (i) functional analysis of single nucleotide polymorphisms and other DNA polymorphisms is supported by chromosomal queries; (ii) network analysis identifies enriched protein–protein interaction modules in gene lists; (iii) functional analysis covers human disease genes; and (iv) improved statistics and filtering provide more concise results. g:Profiler is a regularly updated resource that is available for a wide range of species, including mammals, plants, fungi and insects.
KOBAS 2.0: a web server for annotation and identification of enriched pathways and diseases
Abstract: High-throughput experimental technologies often identify dozens to hundreds of genes related to, or changed in, a biological or pathological process. From these genes one wants to identify biological pathways that may be involved and diseases that may be implicated. Here, we report a web server, KOBAS 2.0, which annotates an input set of genes with putative pathways and disease relationships based on mapping to genes with known annotations. It allows for both ID mapping and cross-species sequence similarity mapping. It then performs statistical tests to identify statistically significantly enriched pathways and diseases. KOBAS 2.0 incorporates knowledge across 1327 species from 5 pathway databases (KEGG PATHWAY, PID, BioCyc, Reactome and Panther) and 5 human disease databases (OMIM, KEGG DISEASE, FunDO, GAD and NHGRI GWAS Catalog). KOBAS 2.0 can be accessed at http://kobas.cbi.pku.edu.cn.
ICSNPathway: identify candidate causal SNPs and pathways from genome-wide association study by one analytical framework
Abstract: Genome-wide association study (GWAS) is widely utilized to identify genes involved in human complex disease or some other trait. One key challenge for GWAS data interpretation is to identify causal SNPs and provide profound evidence on how they affect the trait. Currently, researches are focusing on identification of candidate causal variants from the most significant SNPs of GWAS, while there is lack of support on biological mechanisms as represented by pathways. Although pathway-based analysis (PBA) has been designed to identify disease-related pathways by analyzing the full list of SNPs from GWAS, it does not emphasize on interpreting causal SNPs. To our knowledge, so far there is no web server available to solve the challenge for GWAS data interpretation within one analytical framework. ICSNPathway is developed to identify candidate causal SNPs and their corresponding candidate causal pathways from GWAS by integrating linkage disequilibrium (LD) analysis, functional SNP annotation and PBA. ICSNPathway provides a feasible solution to bridge the gap between GWAS and disease mechanism study by generating hypothesis of SNP → gene → pathway(s). The ICSNPathway server is freely available at http://icsnpathway.psych.ac.cn/.
AnnotQTL: a new tool to gather functional and comparative information on a genomic region
Abstract: AnnotQTL is a web tool designed to aggregate functional annotations from different prominent web sites by minimizing the redundancy of information. Although thousands of QTL regions have been identified in livestock species, most of them are large and contain many genes. This tool was therefore designed to assist the characterization of genes in a QTL interval region as a step towards selecting the best candidate genes. It localizes the gene to a specific region (using NCBI and Ensembl data) and adds the functional annotations available from other databases (Gene Ontology, Mammalian Phenotype, HGNC and Pubmed). Both human genome and mouse genome can be aligned with the studied region to detect synteny and segment conservation, which is useful for running inter-species comparisons of QTL locations. Finally, custom marker lists can be included in the results display to select the genes that are closest to your most significant markers. We use examples to demonstrate that in just a couple of hours, AnnotQTL is able to identify all the genes located in regions identified by a full genome scan, with some highlighted based on both location and function, thus considerably increasing the chances of finding good candidate genes. AnnotQTL is available at http://annotqtl.genouest.org.
Génie: literature-based gene prioritization at multi genomic scale
Abstract: Biomedical literature is traditionally used as a way to inform scientists of the relevance of genes in relation to a research topic. However many genes, especially from poorly studied organisms, are not discussed in the literature. Moreover, a manual and comprehensive summarization of the literature attached to the genes of an organism is in general impossible due to the high number of genes and abstracts involved. We introduce the novel Génie algorithm that overcomes these problems by evaluating the literature attached to all genes in a genome and to their orthologs according to a selected topic. Génie showed high precision (up to 100%) and the best performance in comparison to other algorithms in most of the benchmarks, especially when high sensitivity was required. Moreover, the prioritization of zebrafish genes involved in heart development, using human and mouse orthologs, showed high enrichment in differentially expressed genes from microarray experiments. The Génie web server supports hundreds of species, millions of genes and offers novel functionalities. Common run times below a minute, even when analyzing the human genome with hundreds of thousands of literature records, allows the use of Génie in routine lab work. Availability: http://cbdm.mdc-berlin.de/tools/genie/.
Nucleic Acids Research: Web Server Issue
Replication of >180 Genetic Associations with Self-Report Medical Data
DNA genotyping and sequencing are getting cheaper every day. As Oxford Nanopore CTO Clive Brown recently discussed at Genomes Unzipped, when the cost of a full DNA sequence begins to fall below $1000, the value of having that information far outweighs the cost of data generation.
Participant collection and ascertainment, however, isn't getting cheaper any time soon, spurring a burgeoning interest in using DNA biobanks and electronic medical records (EMRs) for genomics research (reviewed here). In fact, this is exactly the focus of the eMERGE network - a consortium of five sites having biobanks linked to electronic medical records for genetic research. The first order of business for the eMERGE network was assessment - can DNA biobanks + EMRs be used for genetic research? This question was answered with a demonstration project using Vanderbilt University's BioVU biobank+EMR. Here, 21 previously reported associations to five complex diseases were tested for association to electronically abstracted phenotypes from BioVU's EMR. This forest plot shows that for the 21 previously reported associations (red), five replicated at a nominal significance threshold, and for the rest, the calculated odds ratios (blue) trended in the same direction as the reported association.

While electronic phenotyping is much cheaper than ascertainment in the traditional sense, it can still be costly and labor intensive, involving interative cycles of manual medical record chart review followed by refinement of natural language processing algorithms. In many instances, self-report can be comparably accurate, and much easier to obtain (for example, compare the eMERGE network's hypothyroidism phenotyping algorithm with simply asking the question: "Have you ever been diagnosed with Hashmoto's Thyroiditis?").
This is the approach to genetic research 23andMe is taking. Joyce Tung presented some preliminary results at last year's ASHG conference, and now you can read the preprint of the research paper online at Nature Preceedings - "Efficient Replication of Over 180 Genetic Associations with Self-Reported Medical Data". In this paper the authors amassed self-reported data from >20,000 genotyped 23andMe customers on 50 medical phenotypes and attempted to replicate known findings from the GWAS catalog. Using only self-reported data, the authors were able to replicate at a nominal significance level 75% of the previously reported associations that they were powered to detect. Figure 1 from the preprint is similar to the figure above, where blue X's are prior GWAS hits and black dots and lines represent their ORs and 95% CI's:

One might ask whether there is any confounding due to the fact that 23andMe customers can view trait/disease risks before answering questions (see this paper and this discussion by Luke Jostins). The authors investigated this and did not observe a consistent or significant effect of seeing genetic risk results before answering questions. There's also a good discussion regarding SNPs that failed to replicate, and a general discussion of using self-report from a recontactable genotyped cohort for genetic studies.
Other than 23andMe's customer base, I can't think of any other genotyped, recontactable cohort that have incentive to fill out research surveys for this kind of study. But this team has shown here and in the past that this model for performing genetic research works and is substantially cheaper than traditional ascertainment or even mining electronic medical records. I look forward to seeing more research results from this group!
Efficient Replication of Over 180 Genetic Associations with Self-Reported Medical Data
Participant collection and ascertainment, however, isn't getting cheaper any time soon, spurring a burgeoning interest in using DNA biobanks and electronic medical records (EMRs) for genomics research (reviewed here). In fact, this is exactly the focus of the eMERGE network - a consortium of five sites having biobanks linked to electronic medical records for genetic research. The first order of business for the eMERGE network was assessment - can DNA biobanks + EMRs be used for genetic research? This question was answered with a demonstration project using Vanderbilt University's BioVU biobank+EMR. Here, 21 previously reported associations to five complex diseases were tested for association to electronically abstracted phenotypes from BioVU's EMR. This forest plot shows that for the 21 previously reported associations (red), five replicated at a nominal significance threshold, and for the rest, the calculated odds ratios (blue) trended in the same direction as the reported association.

While electronic phenotyping is much cheaper than ascertainment in the traditional sense, it can still be costly and labor intensive, involving interative cycles of manual medical record chart review followed by refinement of natural language processing algorithms. In many instances, self-report can be comparably accurate, and much easier to obtain (for example, compare the eMERGE network's hypothyroidism phenotyping algorithm with simply asking the question: "Have you ever been diagnosed with Hashmoto's Thyroiditis?").
This is the approach to genetic research 23andMe is taking. Joyce Tung presented some preliminary results at last year's ASHG conference, and now you can read the preprint of the research paper online at Nature Preceedings - "Efficient Replication of Over 180 Genetic Associations with Self-Reported Medical Data". In this paper the authors amassed self-reported data from >20,000 genotyped 23andMe customers on 50 medical phenotypes and attempted to replicate known findings from the GWAS catalog. Using only self-reported data, the authors were able to replicate at a nominal significance level 75% of the previously reported associations that they were powered to detect. Figure 1 from the preprint is similar to the figure above, where blue X's are prior GWAS hits and black dots and lines represent their ORs and 95% CI's:
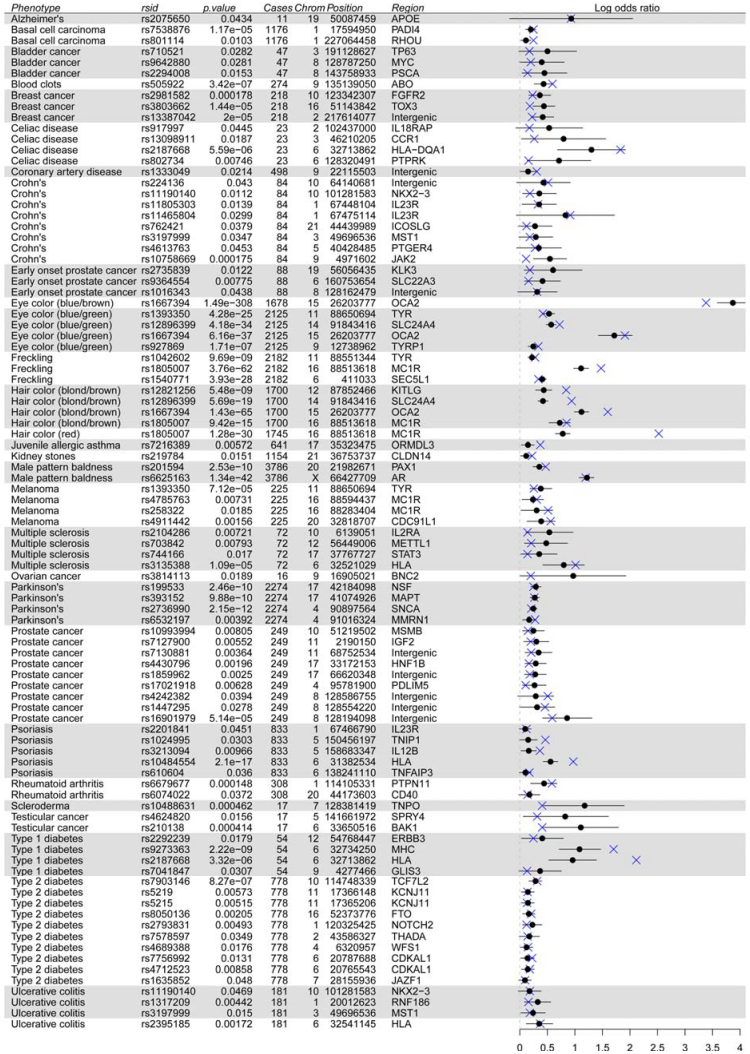
One might ask whether there is any confounding due to the fact that 23andMe customers can view trait/disease risks before answering questions (see this paper and this discussion by Luke Jostins). The authors investigated this and did not observe a consistent or significant effect of seeing genetic risk results before answering questions. There's also a good discussion regarding SNPs that failed to replicate, and a general discussion of using self-report from a recontactable genotyped cohort for genetic studies.
Other than 23andMe's customer base, I can't think of any other genotyped, recontactable cohort that have incentive to fill out research surveys for this kind of study. But this team has shown here and in the past that this model for performing genetic research works and is substantially cheaper than traditional ascertainment or even mining electronic medical records. I look forward to seeing more research results from this group!
Efficient Replication of Over 180 Genetic Associations with Self-Reported Medical Data
Resources for Pathway Analysis, Functional Annotation, and Interactome Reconstruction with Omics Data
I just read a helpful paper on pathway analysis and interactome reconstruction:
Tieri, P., Fuente, A. D., Termanini, A., & Franceschi, C. (2011). Integrating Omics Data for Signaling Pathways, Interactome Reconstruction, and Functional Analysis. In Bioinformatics for Omics Data, Methods in Molecular Biology, vol. 719. doi: 10.1007/978-1-61779-027-0. (PubMed).
The authors give a description about how each of these tools can be used in pathway analysis and functional annotation, along with an example of using several of these resources for mapping the interactome for transcription factor NF-kappa-B.
While a more extensive list of hundreds of tools and databases for biological pathway analysis can be found at Pathguide, this looks like a good starting point.
Integrating Omics data for signaling pathways, interactome reconstruction, and functional analysis.
Tieri, P., Fuente, A. D., Termanini, A., & Franceschi, C. (2011). Integrating Omics Data for Signaling Pathways, Interactome Reconstruction, and Functional Analysis. In Bioinformatics for Omics Data, Methods in Molecular Biology, vol. 719. doi: 10.1007/978-1-61779-027-0. (PubMed).
The authors give a description about how each of these tools can be used in pathway analysis and functional annotation, along with an example of using several of these resources for mapping the interactome for transcription factor NF-kappa-B.
While a more extensive list of hundreds of tools and databases for biological pathway analysis can be found at Pathguide, this looks like a good starting point.
| • | APID Agile Protein Interaction DataAnalyzer – http://bioinfow.dep.usal.es/apid/index.htm |
| • | Ariadne Genomics Pathway Studio – http://www.ariadnegenomics.com/products/pathway-studio |
| • | BIND Biomolecular Interaction Network Database – http://www.bind.ca |
| • | BioCarta Pathways – http://www.biocarta.com/genes/index.asp |
| • | BioGRID The Biological General Repository for Interaction Datasets – http://www.thebiogrid.org |
| • | BiologicalNetworks – http://biologicalnetworks.net |
| • | CellDesigner – http://www.celldesigner.org |
| • | ClusterMaker – http://www.cgl.ucsf.edu/cytoscape/cluster/clusterMaker.html |
| • | Cytoscape – http://www.cytoscape.org |
| • | DIP Database of Interacting Proteins – http://dip.doe-mbi.ucla.edu/dip/Main.cgi |
| • | Entrez Gene – http://www.ncbi.nlm.nih.gov/gene |
| • | GenMAPP Gene Map Annotator and Pathway Profiler – http://www.genmapp.org |
| • | GraphWeb – http://biit.cs.ut.ee/graphweb |
| • | HPRD Human Protein Reference Database – http://www.hprd.org |
| • | HUBBA Hub objects analyzer – http://hub.iis.sinica.edu.tw/Hubba |
| • | Ingenuity Systems – http://www.ingenuity.com |
| • | IntAct – http://www.ebi.ac.uk/intact |
| • | KEGG Kyoto Encyclopedia of Genes and Genomes – http://www.genome.jp/kegg |
| • | MINT the Molecular INTeraction database – http://mint.bio.uniroma2.it/mint |
| • | NCI-Nature Pathway Interaction Database – http://pid.nci.nih.gov |
| • | NetPath – http://www.netpath.org |
| • | NetworkAnalyzer – http://med.bioinf.mpi-inf.mpg.de/netanalyzer |
| • | |
| • | Pathguide: the pathway resource list – http://www.pathguide.org |
| • | PathVisio – http://www.pathvisio.org |
| • | Pathway Commons – http://www.pathwaycommons.org |
| • | R Project for Statistical Computing – http://www.r-project.org |
| • | Reactome – http://www.reactome.org |
| • | SBW Systems Biology Workbench – http://sbw.sourceforge.net |
| • | TRANSFAC & TRANSPATH – http://www.gene-regulation.com |
| • | TRED Transcriptional Regulatory Element Database – http://rulai.cshl.edu/cgi-bin/TRED |
| • | UniProt – http://www.uniprot.org |
| • | WikiPathways – http://www.wikipathways.org/index.php/WikiPathways |
Integrating Omics data for signaling pathways, interactome reconstruction, and functional analysis.
Subscribe to:
Posts (Atom)