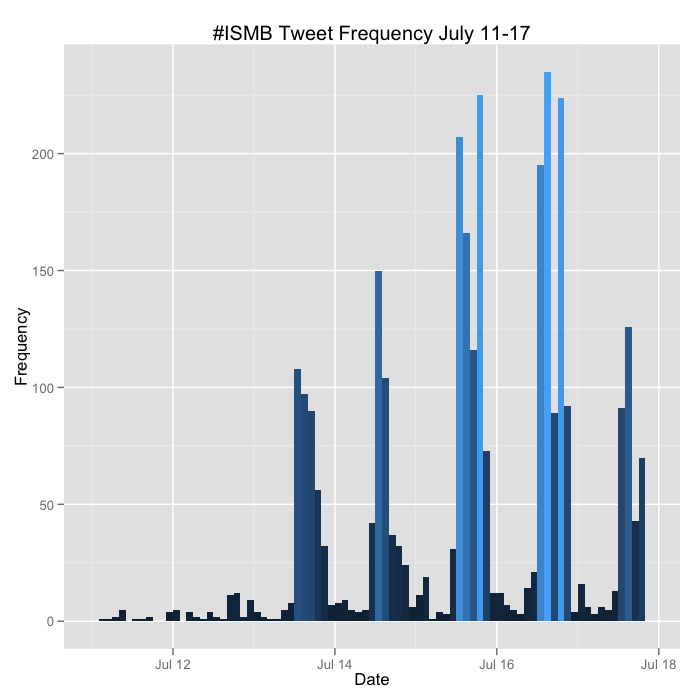
The code below also tabulates the total number of tweets by username, and plots the 40 most prolific. Interestingly several of the folks in this list weren't even at the meeting.
I'll update the plots above at the conclusion of the meeting.
I'll update the plots above at the conclusion of the meeting.
Here's the code below. There's a limitation with this code - you can only retrieve a maximum of 1500 tweets per query without authenticating via OAuth before you receive a 403 error. The twitteR package had a good vignette about how to use the ROAuth package to do this, but I was never able to get it to work properly. The version on CRAN (0.9.1) has known issues, but even when rolling back to 0.9.0 or upgrading to 0.9.2 from the author's homepage, I still received the 403 signal. So my hackjob workaround was to write a loop to fetch all the tweets one day at a time and then flatten this into a single list before converting to a data frame. You still run into the limitation of only being able to retrieve the first 1500 for each day, but #ISMB never had more than 1500 any one day. If you can solve my ROAuth problem, please leave a comment or fork the code on GitHub.


