


The first post on Getting Genetics Done was one year ago today. To celebrate, here are the top 10 most viewed posts since GGD launched last year. Incidentally, nine of the ten are tutorials on how to do something in R. Thanks to all the readers and all the commenters for sharing your thoughts!
ggplot2 Tutorial: Scatterplots in a Series of Small Multiples
GWAS Manhattan plots and QQ plots using ggplot2 in R
Hierarchical Clustering in R (by Will Bush)
Comparison of plots using Stata, R base, R lattice, and R ggplot2: Histograms
Merge data from different files using R
QQ plots of p-values in R using ggplot2
PDF tutorial from R course (Introduction to R)
Visualizing sample relatedness in a GWAS using PLINK and R
Split, apply, and combine in R using PLYR
Linux Command Line Cheat Sheet
JMP Genomics Workshop
Doug Robinson (JMP Academic Division, SAS Institute) is giving a presentation of the JMP Genomics software from SAS illustrating data analysis for genetics, expression, and copy number variation studies. Agenda includes: CNV analysis, merging CNV data sets of continuous traits, and QC, analysis, and downstream applications of expression studies.
Tuesday Feb 23, 11 am
512 Light Hall
Tuesday Feb 23, 11 am
512 Light Hall
"Synthetic associations" - an alternative point of view
If you read the previously mentioned "synthetic associations" paper in PLoS Bio by Dickson et al. in David Goldstein's group, be sure to read this brief commentary written by Pat Sullivan at UNC offering a different point of view. The original paper created the liveliest discussion we've had in journal club since we talked about the ISC en masse paper, and Sullivan's commentary very nicely mirrors some of our own thoughts on the paper that were brought up at journal club last week.
Patrick Sullivan: “Synthetic” Ado About Nothing?
Patrick Sullivan: “Synthetic” Ado About Nothing?
ROADTRIPS: Case-Control Association Testing with Partially or Completely Unknown Population and Pedigree Structure
A tip of the hat to @JVJAI for pointing out this interesting looking paper in AJHG.
ROADTRIPS: Case-Control Association Testing with Partially or Completely Unknown Population and Pedigree Structure
Timothy Thornton and Mary Sara McPeek
Department of Biostatistics, University of Washington.
Abstract: Genome-wide association studies are routinely conducted to identify genetic variants that influence complex disorders. It is well known that failure to properly account for population or pedigree structure can lead to spurious association as well as reduced power. We propose a method, ROADTRIPS, for case-control association testing in samples with partially or completely unknown population and pedigree structure. ROADTRIPS uses a covariance matrix estimated from genome-screen data to correct for unknown population and pedigree structure while maintaining high power by taking advantage of known pedigree information when it is available. ROADTRIPS can incorporate data on arbitrary combinations of related and unrelated individuals and is computationally feasible for the analysis of genetic studies with millions of markers. In simulations with related individuals and population structure, including admixture, we demonstrate that ROADTRIPS provides a substantial improvement over existing methods in terms of power and type 1 error. The ROADTRIPS method can be used across a variety of study designs, ranging from studies that have a combination of unrelated individuals and small pedigrees to studies of isolated founder populations with partially known or completely unknown pedigrees. We apply the method to analyze two data sets: a study of rheumatoid arthritis in small UK pedigrees, from Genetic Analysis Workshop 15, and data from the Collaborative Study of the Genetics of Alcoholism on alcohol dependence in a sample of moderate-size pedigrees of European descent, from Genetic Analysis Workshop 14. We detect genome-wide significant association, after Bonferroni correction, in both studies.
ROADTRIPS: Case-Control Association Testing with Partially or Completely Unknown Population and Pedigree Structure
Timothy Thornton and Mary Sara McPeek
Department of Biostatistics, University of Washington.
Abstract: Genome-wide association studies are routinely conducted to identify genetic variants that influence complex disorders. It is well known that failure to properly account for population or pedigree structure can lead to spurious association as well as reduced power. We propose a method, ROADTRIPS, for case-control association testing in samples with partially or completely unknown population and pedigree structure. ROADTRIPS uses a covariance matrix estimated from genome-screen data to correct for unknown population and pedigree structure while maintaining high power by taking advantage of known pedigree information when it is available. ROADTRIPS can incorporate data on arbitrary combinations of related and unrelated individuals and is computationally feasible for the analysis of genetic studies with millions of markers. In simulations with related individuals and population structure, including admixture, we demonstrate that ROADTRIPS provides a substantial improvement over existing methods in terms of power and type 1 error. The ROADTRIPS method can be used across a variety of study designs, ranging from studies that have a combination of unrelated individuals and small pedigrees to studies of isolated founder populations with partially known or completely unknown pedigrees. We apply the method to analyze two data sets: a study of rheumatoid arthritis in small UK pedigrees, from Genetic Analysis Workshop 15, and data from the Collaborative Study of the Genetics of Alcoholism on alcohol dependence in a sample of moderate-size pedigrees of European descent, from Genetic Analysis Workshop 14. We detect genome-wide significant association, after Bonferroni correction, in both studies.
Keep your lab notebook in a private blog

The idea of using a blogging platform for your lab notebook is pretty simple and the advantages are numerous. All your entries are automatically dated appear chronologically. You can view your notebook or make new entries from anywhere in the world. You can copy and paste useful code snippets, upload images and documents, and take advantages of tags and search features present with most blogging platforms. I keep my lab notebook private - search engines can't index it, and I have to give someone permission to view before they can see it. Once you've allowed someone to view your blog/notebook, you can also allow them to comment on posts. This is a great way for my mentor to keep track of result and make suggestions. And I can't count how many times I've gone back to an older notebook entry to view the code that I used to do something quickly in R or PLINK but didn't bother to save anywhere else.
Of course Blogger isn't the only platform that can do this, although it's free and one of the easiest to get set up, especially if you already have a Google account. Wordpress is very similar, and has tons of themes. You can find lots of comparisons between the two online. If you have your own web host, you can install the open-source version of Wordpress on your own host, for added security and access control (see this explanation of the differences between Wordpress.com and Wordpress.org).
Another note-taking platform I've been using recently is Evernote. Lifehacker blog has a great overview of Evernote's features. It runs as a desktop application, and it syncs across all your computers, and online in a web interface also. The free account lets you sync 40MB a month, which is roughly the equivalent of 20,000 typed notes. This quota resets every month, and you start fresh at 40MB. You can also attach PDFs to a note, and link notes to URLs. Every note is full-text searchable.
And then of course there's the non-free option: Microsoft OneNote. Although it will set you back a few bucks, it integrates very nicely with many features on your Windows machine. I've never used OneNote.
Seminar: Statistical Methods for DNA Resequencing Analysis in Disease-Gene Studies
Department of Biostatistics Seminar/Workshop Series:
Statistical Methods for DNA Resequencing Analysis in Disease-Gene Studies
Wenyi Wang, Ph.D., Faculty Candidate
Stanford Genome Technology Center, UC Berkeley Statistics
2:00-3:00pm
Monday, February 15, 2010
MRB III Room 1220
Intended Audience: Persons interested in applied statistics, statistical theory, epidemiology, health services research, clinical trials methodology, statistical computing, statistical graphics, R users or potential users
Nuclear genes encode most mitochondrial proteins and their mutations cause diverse and debilitating clinical disorders. To date, 1,200 genes have been recorded to be associated with mitochondrial diseases. Identifying DNA variants in these genes in individuals affected by mitochondrial diseases remains a major challenge, because many diseases are thought to be associated with rare variants (minor allele frequency <1%). Medical resequencing arrays enable cost-efficient and high-throughput sequencing of candidate genes. For diploid genomes, available base-calling tools only achieve high accuracy by calling a portion of all nucleotide positions.
Distinct from whole-genome SNP data, the array-based resequencing data present a very low frequency of biological signals (genetic variations from a reference sequence), which motivated us to develop a new statistical method, SRMA (Sequence Robust Multi-array Analysis). Our challenge was to fully detect sequence variations with minimal false discoveries, when sequencing errors occur at high frequencies. We extended the multi-level mixture models, previously deployed for SNP arrays, to accurately call single heterozygous samples at rare variant positions. We demonstrate our methods in a resequencing study of 39 candidate genes among healthy individuals and patients with mitochondrial diseases.
Statistical Methods for DNA Resequencing Analysis in Disease-Gene Studies
Wenyi Wang, Ph.D., Faculty Candidate
Stanford Genome Technology Center, UC Berkeley Statistics
2:00-3:00pm
Monday, February 15, 2010
MRB III Room 1220
Intended Audience: Persons interested in applied statistics, statistical theory, epidemiology, health services research, clinical trials methodology, statistical computing, statistical graphics, R users or potential users
Nuclear genes encode most mitochondrial proteins and their mutations cause diverse and debilitating clinical disorders. To date, 1,200 genes have been recorded to be associated with mitochondrial diseases. Identifying DNA variants in these genes in individuals affected by mitochondrial diseases remains a major challenge, because many diseases are thought to be associated with rare variants (minor allele frequency <1%). Medical resequencing arrays enable cost-efficient and high-throughput sequencing of candidate genes. For diploid genomes, available base-calling tools only achieve high accuracy by calling a portion of all nucleotide positions.
Distinct from whole-genome SNP data, the array-based resequencing data present a very low frequency of biological signals (genetic variations from a reference sequence), which motivated us to develop a new statistical method, SRMA (Sequence Robust Multi-array Analysis). Our challenge was to fully detect sequence variations with minimal false discoveries, when sequencing errors occur at high frequencies. We extended the multi-level mixture models, previously deployed for SNP arrays, to accurately call single heterozygous samples at rare variant positions. We demonstrate our methods in a resequencing study of 39 candidate genes among healthy individuals and patients with mitochondrial diseases.
Using MySQL to Store and Organize Results from Genetic Analyses
This is the first in a series of posts on how to use MySQL with genetic data analysis. MySQL is a very popular, freely available database management system that is easily installed on desktop computers (or Linux servers). The "SQL" in MySQL stands for Structured Query Language, which is by my humble estimation the most standardized way to store and access information in the known universe. SQL is an easy language to learn, and is fundamentally based on set operations such as unions and intersects.
Over the course of this tutorial, I'll illustrate how to use MySQL to load, store, access, and sort SNP statistics computed by PLINK. To begin, you will need to download and install MySQL on your local machine, and you'll also need to install the MySQL GUI tools.
You can think of MySQL as a massive spreadsheet application like Excel - The basic unit within the database is a table, consisting of rows (sometimes called tuples) and columns (generally called fields). A collection of tables is called a schema (the plural form is schemata) - schemata are typically used for organizational purposes.
After installing MySQL Server and the MySQL GUI Tools, start the MySQL Query Browser. The Query Browser will prompt you for connection information - this information will depend on where you installed the MySQL Server application. Assuming that you installed the Server on your current computer, you would enter "localhost" as the host. Also, when installing MySQL Server, you were required to enter a password for the "root" account (which is the primary administrative account). Enter "root" as the username and the password you specified during setup.
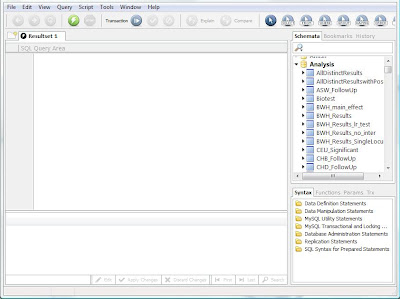
Now you should see the MySQL Query Browser, which has three main panes: the SQL query area, the schemata list, and the results pane. They schemata list is useful for browsing what the database contains, and allows you to see the field names and tables for each schema. The query editor allows you to enter and execute an SQL statement, and the results of that statement are returned in the results pane, which is essentially a read-only spreadsheet.
Lets start by creating a new schema to hold the tables we will make in this tutorial. In the Query Browser, type:
Now let's create a table in the Sandbox schema. If you haven't already, double-click the Sandbox schema in the schemata browser to make it the active schema, then execute the following statement:
This statement created a table called Tutorial in the Sandbox schema that has 3 fields: a character-based field with a max of 30 characters called "name", a character-based field with a max of 150 characters called "address", and an integer-based field called "zipcode".
Now let's load some data into this table. Most genetic analysis applications will output a text file with analysis results -- with this in mind, we'll create a text file containing several names, addresses, and zip codes to load into our new table:
The keyword LOCAL tells the MySQL browser to use files on the computer currently running the MySQL client (in this case the MySQL query browser) rather than the MySQL Server. The FIELDS TERMINATED BY ',' indicates that the file is comma-delimited. If the file were a tab-separated file, the statement would be FIELDS TERMINATED BY '\t'. The last portion inside parentheses tells the browser the order the fields appear in the text file, so if the zipcode were listed first in the text file, the statement would be (zipcode, name, address). Also, note the use of a forward-slash in the file location -- this is because MySQL designers use proper UNIX file locations rather than the heretic DOS-style format with a back-slash.
Now that the data is loaded, lets confirm that it is there and properly formatted in the database. Execute the following statement:
This will return all rows from the Tutorial table to the results pane of the query browser. You should see all four rows and all three columns of our original text file, now neatly organized in our database.
In the next post, I'll show you how to do more sophisticated SELECT statements. Please comment if anything is unclear and I'll do my best to clarify.
Over the course of this tutorial, I'll illustrate how to use MySQL to load, store, access, and sort SNP statistics computed by PLINK. To begin, you will need to download and install MySQL on your local machine, and you'll also need to install the MySQL GUI tools.
You can think of MySQL as a massive spreadsheet application like Excel - The basic unit within the database is a table, consisting of rows (sometimes called tuples) and columns (generally called fields). A collection of tables is called a schema (the plural form is schemata) - schemata are typically used for organizational purposes.
After installing MySQL Server and the MySQL GUI Tools, start the MySQL Query Browser. The Query Browser will prompt you for connection information - this information will depend on where you installed the MySQL Server application. Assuming that you installed the Server on your current computer, you would enter "localhost" as the host. Also, when installing MySQL Server, you were required to enter a password for the "root" account (which is the primary administrative account). Enter "root" as the username and the password you specified during setup.

Now you should see the MySQL Query Browser, which has three main panes: the SQL query area, the schemata list, and the results pane. They schemata list is useful for browsing what the database contains, and allows you to see the field names and tables for each schema. The query editor allows you to enter and execute an SQL statement, and the results of that statement are returned in the results pane, which is essentially a read-only spreadsheet.
Lets start by creating a new schema to hold the tables we will make in this tutorial. In the Query Browser, type:
CREATE DATABASE Sandbox;Notice the semi-colon at the end of the statement - this tells the SQL engine that it has reached the end of an SQL statement. You can execute this statement two ways: 1. Hit Control-Enter, or 2. Click the button with the green lightning bolt. This statement just created a new schema in our database called Sandbox. You can see the new schema in the schemata browser if you right-click inside the schemata tab and choose refresh from the menu. The active schema in the MySQL Query Browser is always shown as bold. You can select a new active schema simply by double-clicking it in the schema browser.
Now let's create a table in the Sandbox schema. If you haven't already, double-click the Sandbox schema in the schemata browser to make it the active schema, then execute the following statement:
CREATE TABLE Tutorial (name varchar(30), address varchar(150), zipcode int);
This statement created a table called Tutorial in the Sandbox schema that has 3 fields: a character-based field with a max of 30 characters called "name", a character-based field with a max of 150 characters called "address", and an integer-based field called "zipcode".
Now let's load some data into this table. Most genetic analysis applications will output a text file with analysis results -- with this in mind, we'll create a text file containing several names, addresses, and zip codes to load into our new table:
Phillip J. Fry,Robot Arms Apartments #455,65774Copy and paste this text into a text file called "futurama_addresses.txt". Now execute the following statement:
Zapp Brannigan,Starship Nimbus Captain's Quarters,45542
Doctor Zoidberg,335 Medical Corporation Way,72552
Hubert J. Farnsworth,Planet Express Delivery Company,88754
LOAD DATA LOCAL INFILE "C:/futurama_addresses.txt" INTO TABLE Tutorial FIELDS TERMINATED BY ',' (name, address, zipcode);
The keyword LOCAL tells the MySQL browser to use files on the computer currently running the MySQL client (in this case the MySQL query browser) rather than the MySQL Server. The FIELDS TERMINATED BY ',' indicates that the file is comma-delimited. If the file were a tab-separated file, the statement would be FIELDS TERMINATED BY '\t'. The last portion inside parentheses tells the browser the order the fields appear in the text file, so if the zipcode were listed first in the text file, the statement would be (zipcode, name, address). Also, note the use of a forward-slash in the file location -- this is because MySQL designers use proper UNIX file locations rather than the heretic DOS-style format with a back-slash.
Now that the data is loaded, lets confirm that it is there and properly formatted in the database. Execute the following statement:
SELECT * FROM Tutorial;
This will return all rows from the Tutorial table to the results pane of the query browser. You should see all four rows and all three columns of our original text file, now neatly organized in our database.
In the next post, I'll show you how to do more sophisticated SELECT statements. Please comment if anything is unclear and I'll do my best to clarify.
Subscribe to:
Posts (Atom)